Analytics
The Analytics screen has three views of the organization's usage (executions and conversations with the Slack bot), all with the same filters:
| Filter | Options |
|---|---|
| Period | today, yesterday, last 7, 30 or 90 days, or a custom range (default: last 30 days) |
| Workspace, Activity, Task | restrict to the chosen executions (conversations have no task: they are left out) |
| Source | Console, Schedule, API, Endpoint, Manage and Slack conversations |
| Group by | tier, workspace, activity, task or source |
Dates follow the organization's time zone.
Usage
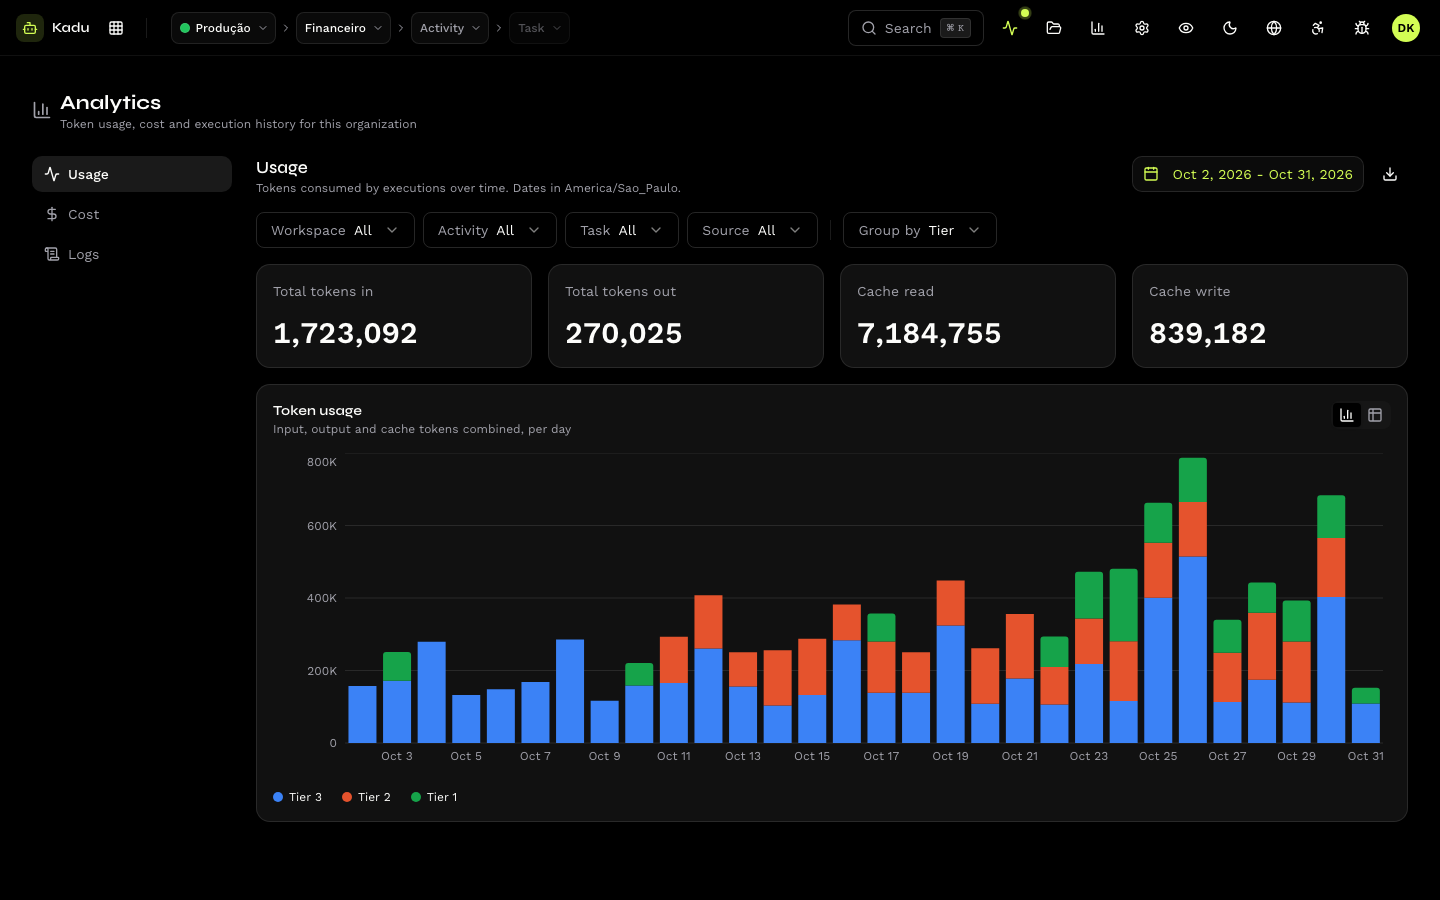
Tokens consumed per day: input, output, cache read and cache write. Switch between chart and table and download the CSV.
Cost
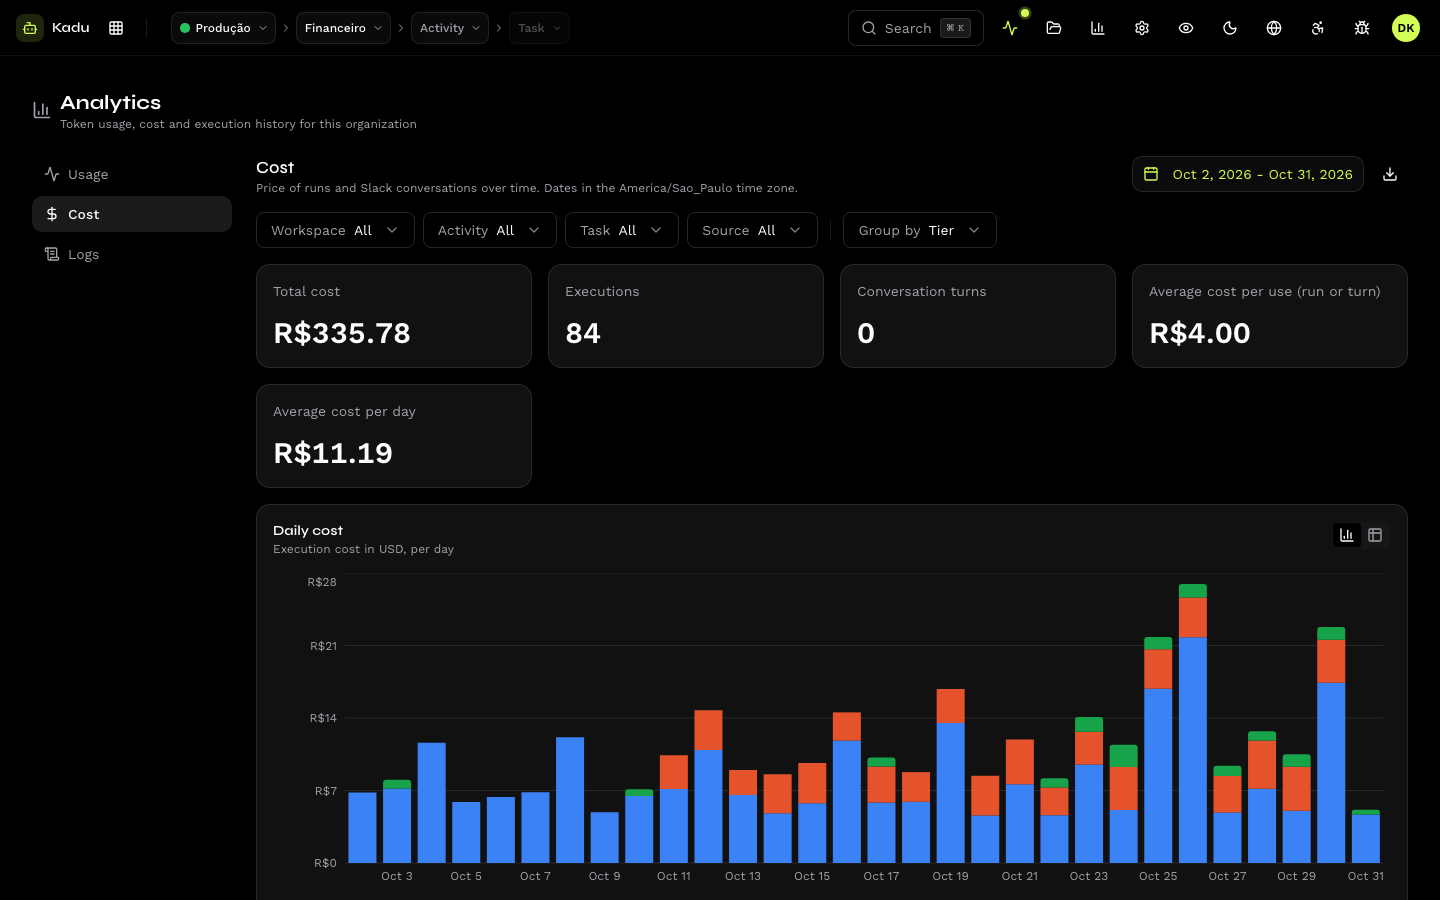
Price of executions and conversations per day, in reais, with the period total, the number of executions, the number of conversation turns, the average cost per use and the average cost per day. See Plan and costs for the difference between cost and price.
Logs
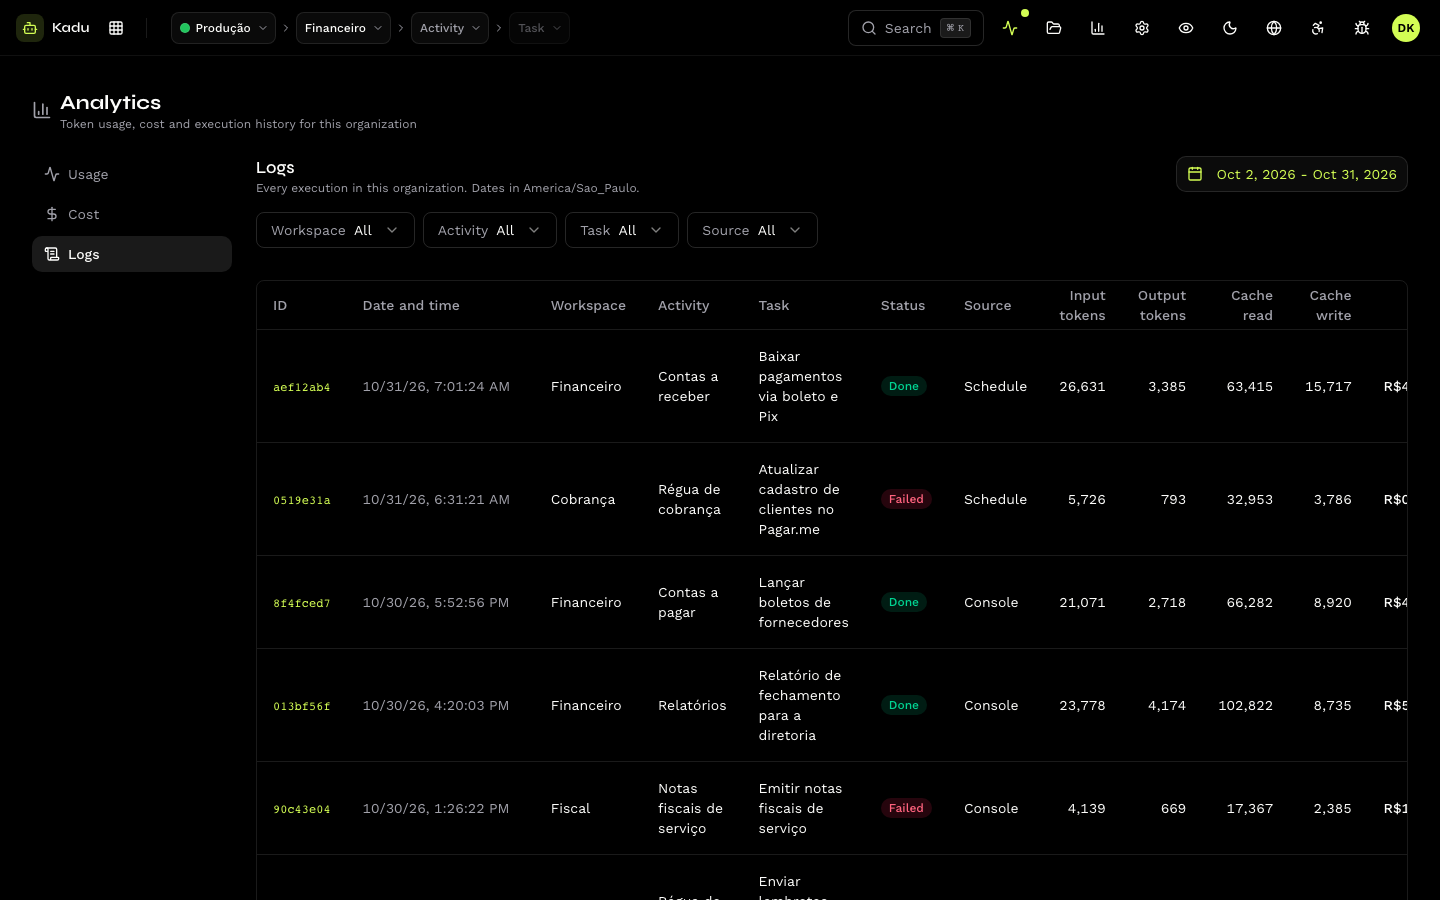
All of the organization's executions in one table: date and time, workspace, activity, task, status, source, tokens and cost. Each row leads to the execution.
Through the API
GET /v1/usage returns aggregated usage and cost (with conversation_turns), and GET /v1/executions
and GET /v1/executions/search list and search executions.