Navigating the Agent Console
The Agent Console (app.kadu.ia.br) is organized around a selected task.
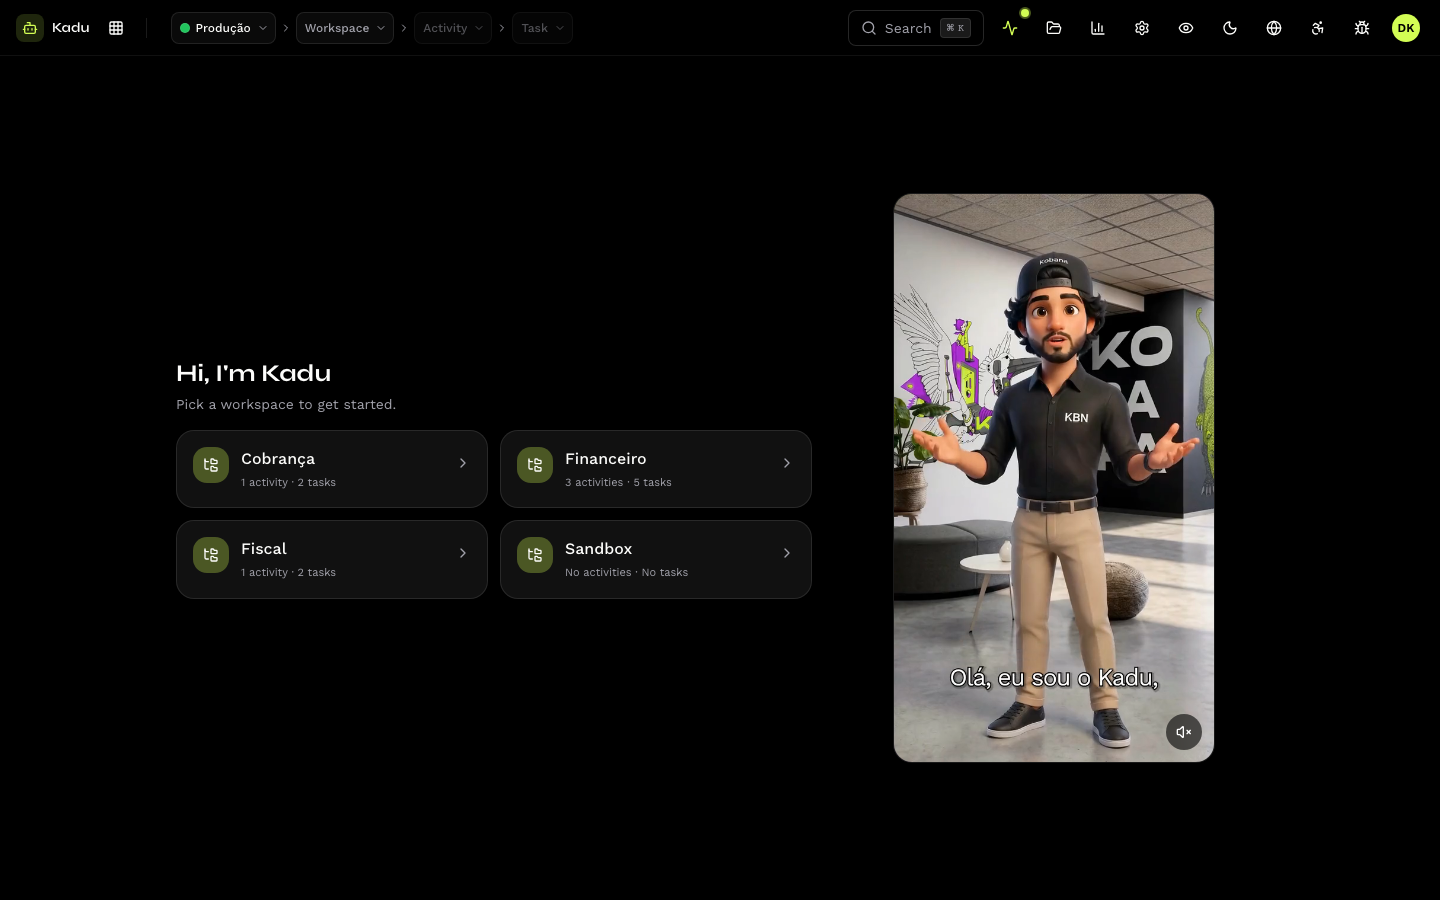
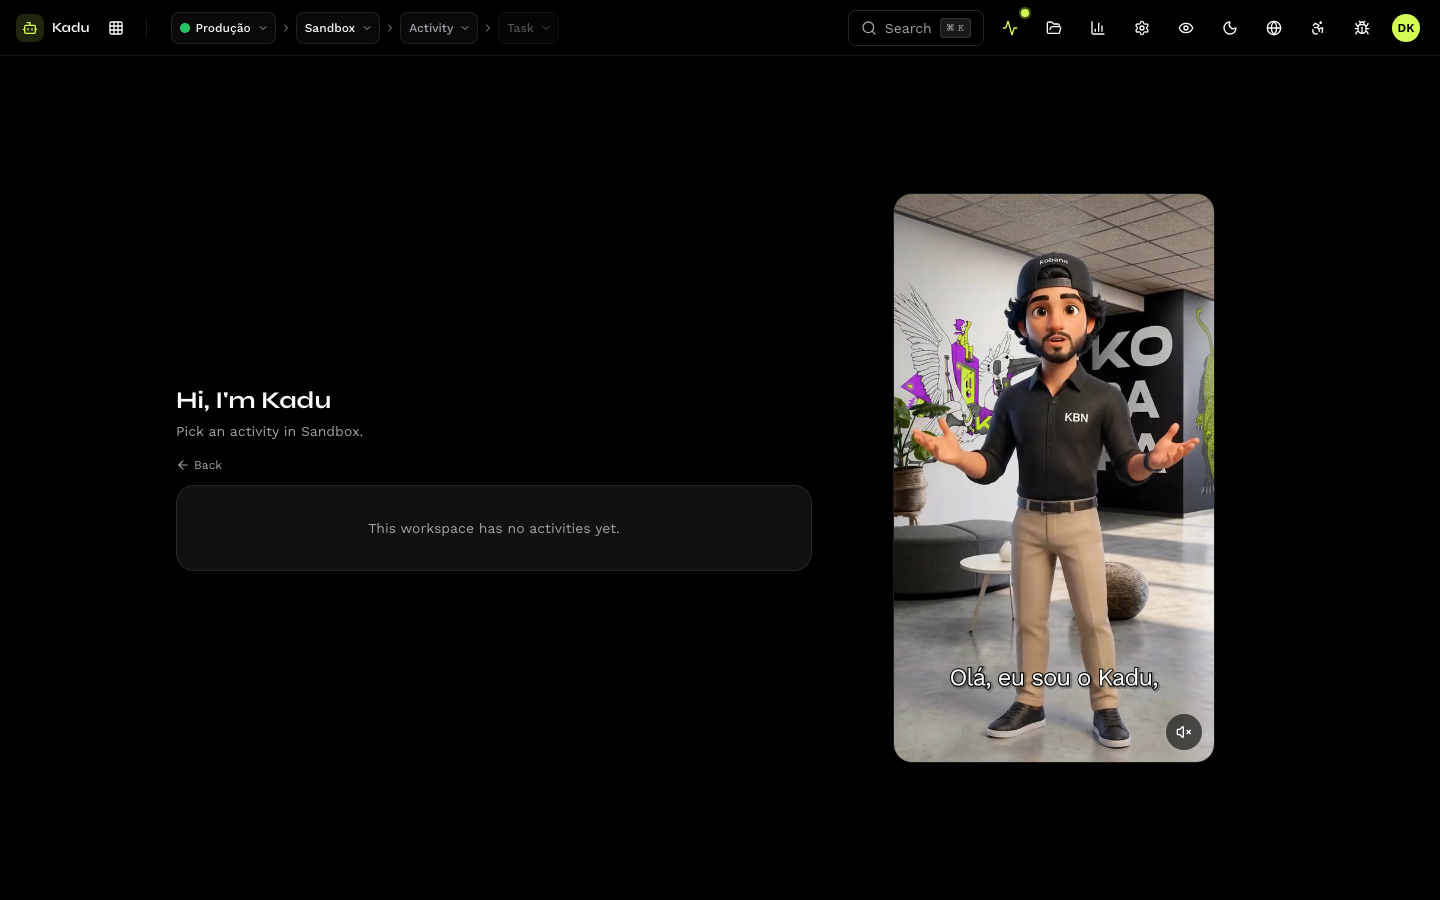
Top bar
The top bar chooses the context for everything shown below it:
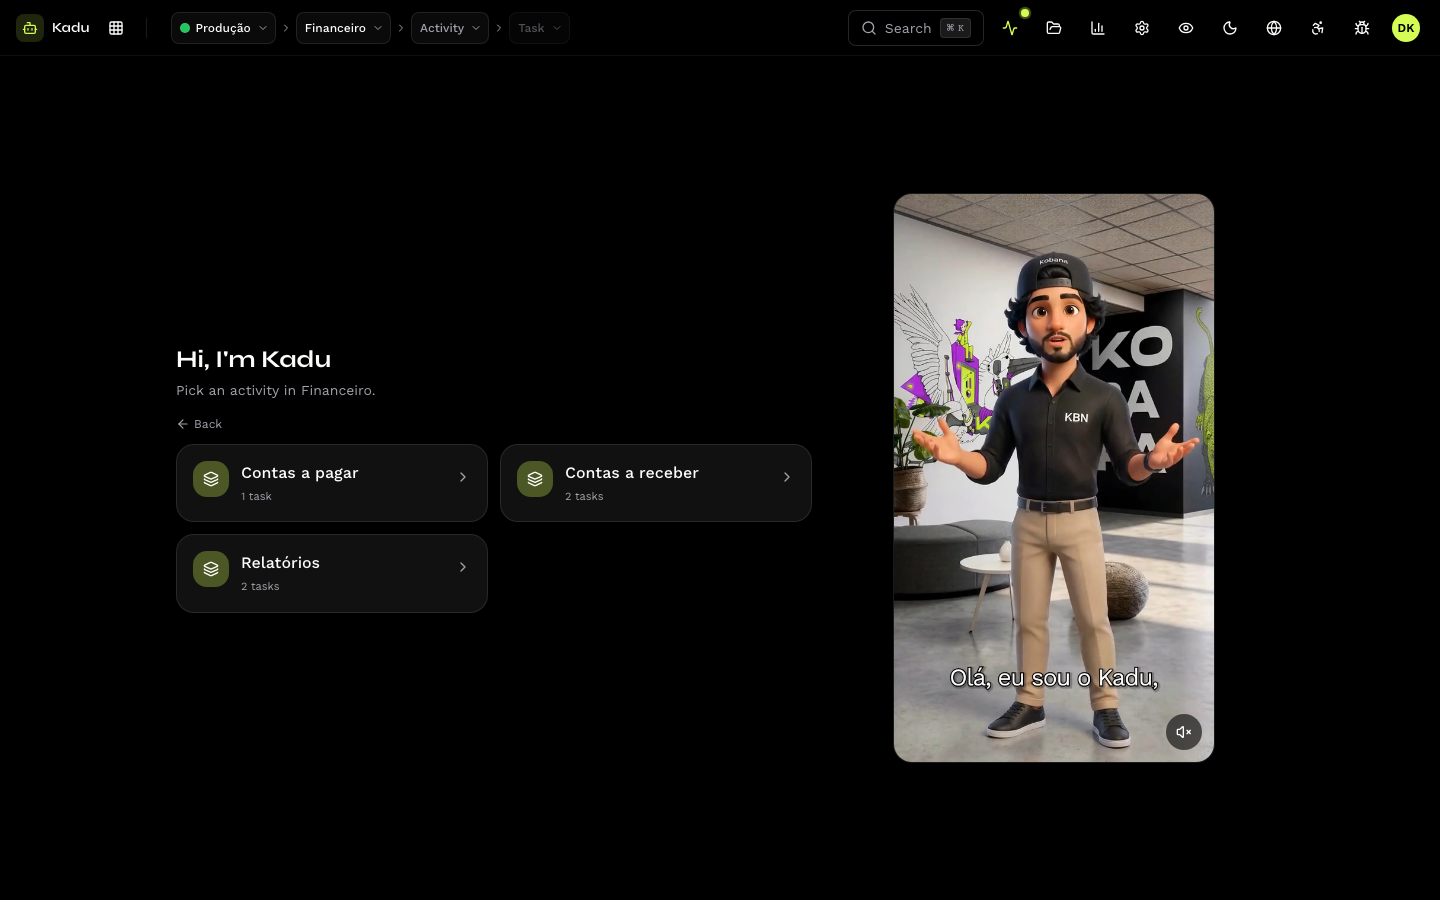
| Selector | What it chooses |
|---|---|
| Organization | the open organization (only appears for people who belong to more than one) |
| Environment | where executions triggered from here will run |
| Workspace → Activity → Task | the task in focus |
With no task chosen, the home screen guides the choice: first the workspace, then the activity, then the task.
Also in the top bar:
- the indicator of the organization's running executions, with a shortcut to each one;
- the global search, which searches executions, logs, events, results and pending items (at least 2 characters);
- the shortcuts to Files, Analytics and Settings (the latter for people who can change the organization);
- the Kobana Apps menu;
- the user menu: profile, Switch organization, theme, policies and Sign out.
Selected task
With a task chosen, the side panel presents the agent: what the task does, the
systems it operates and what it does (the skill's systems and
features fields), followed by the task's list of executions, from newest
to oldest, with each one's reference date.
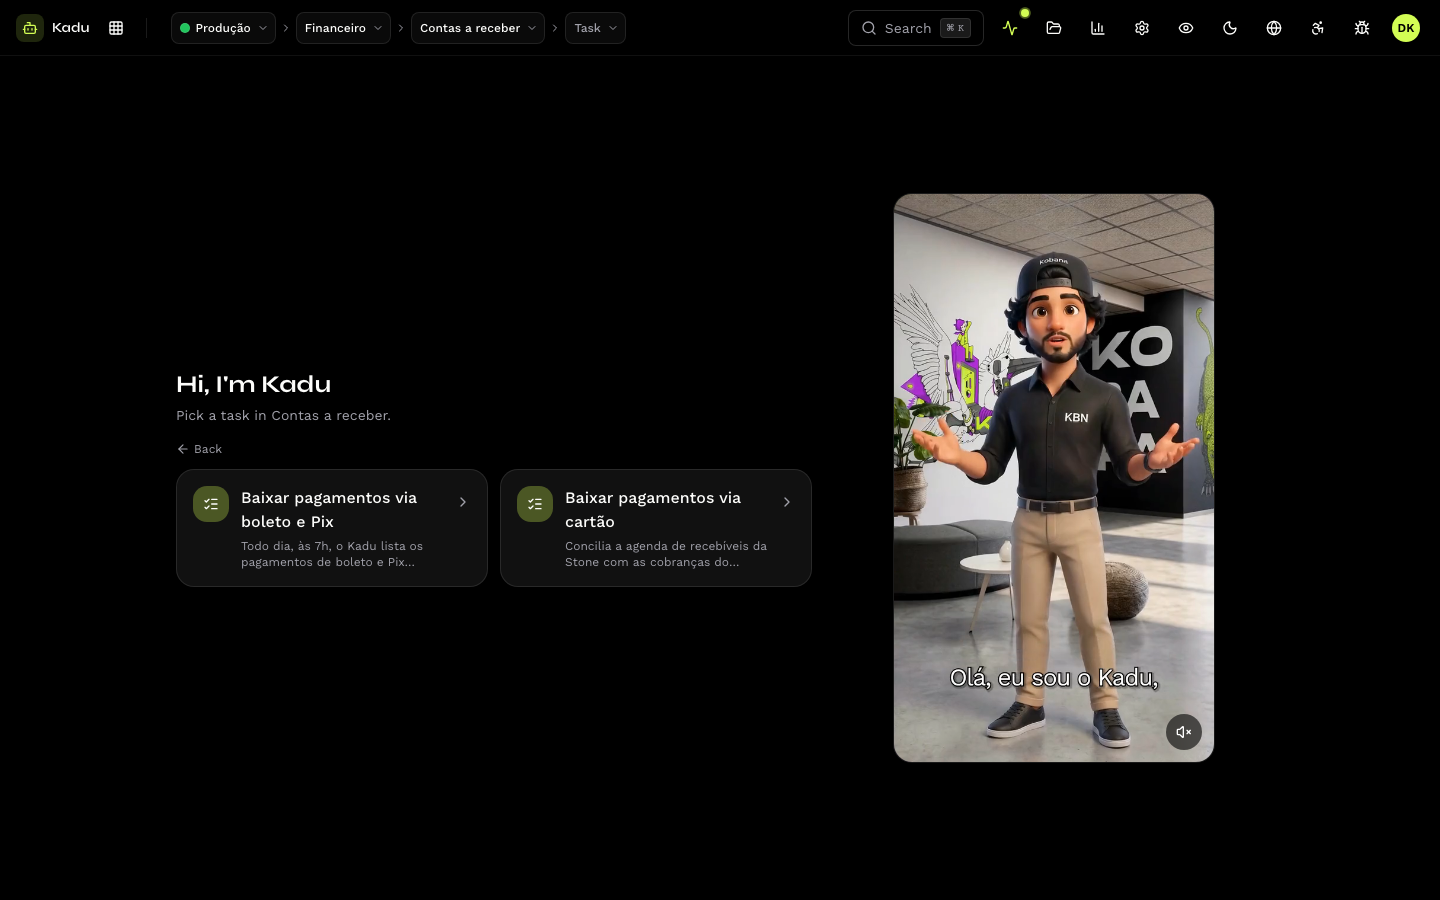
The main area shows the chosen execution, with the tabs described in Follow an execution, and the Run now button.
Other screens
The top bar shortcuts appear once the Playbook is connected:
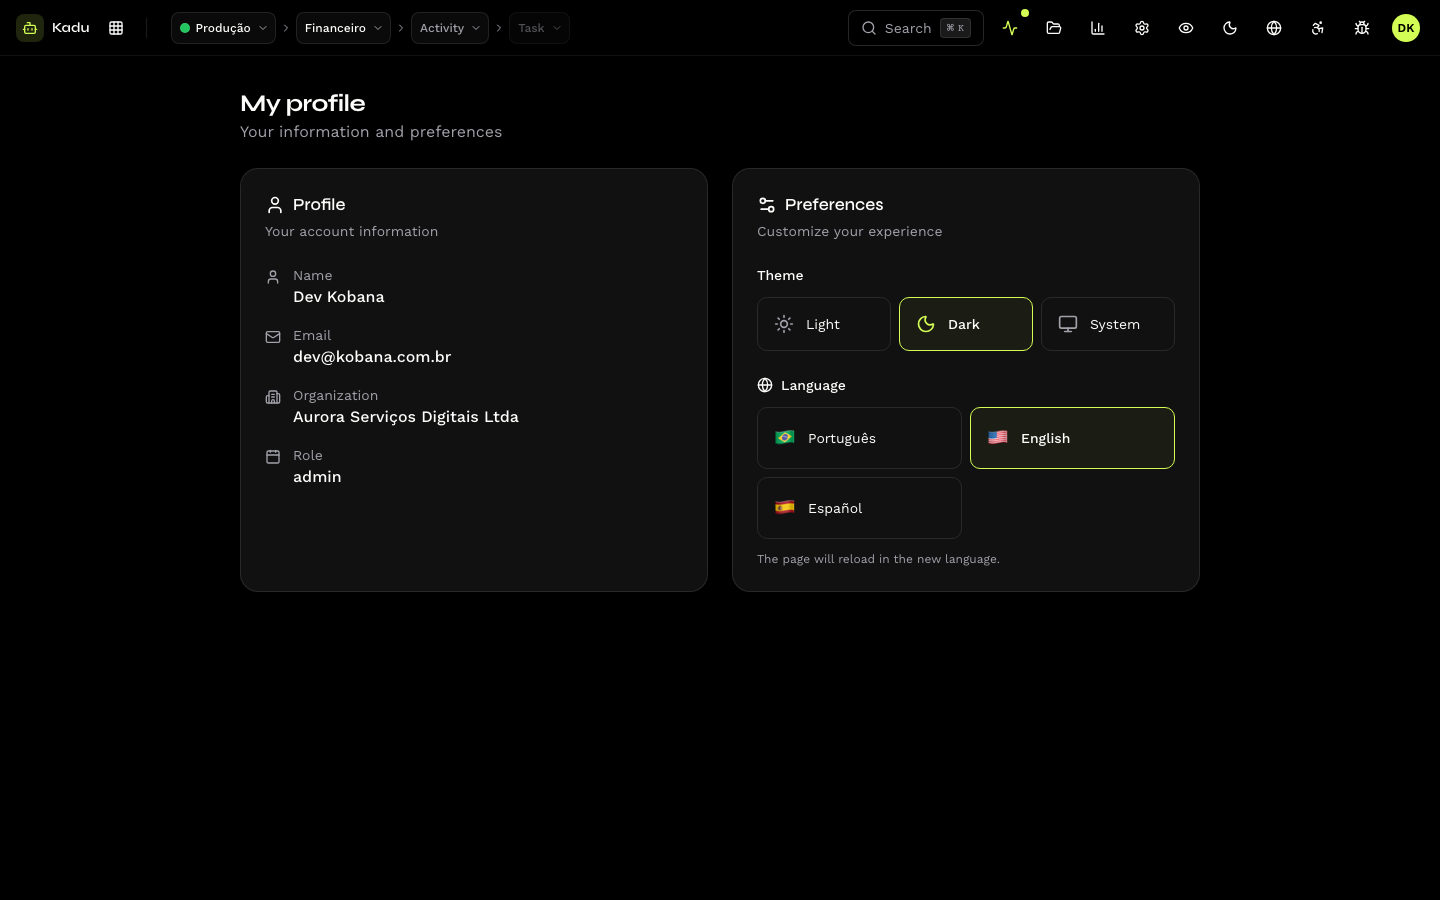
| Screen | What it shows |
|---|---|
| Files | the executions' input and output files (Files) |
| Analytics | token usage, cost and the list of all executions (Analytics) |
| Settings | content, environments, secrets, schedules, endpoints, webhooks and deployment (Settings) |